CellInfo
Investigate cell-specific transcripts and their cell cluster ability.
Options
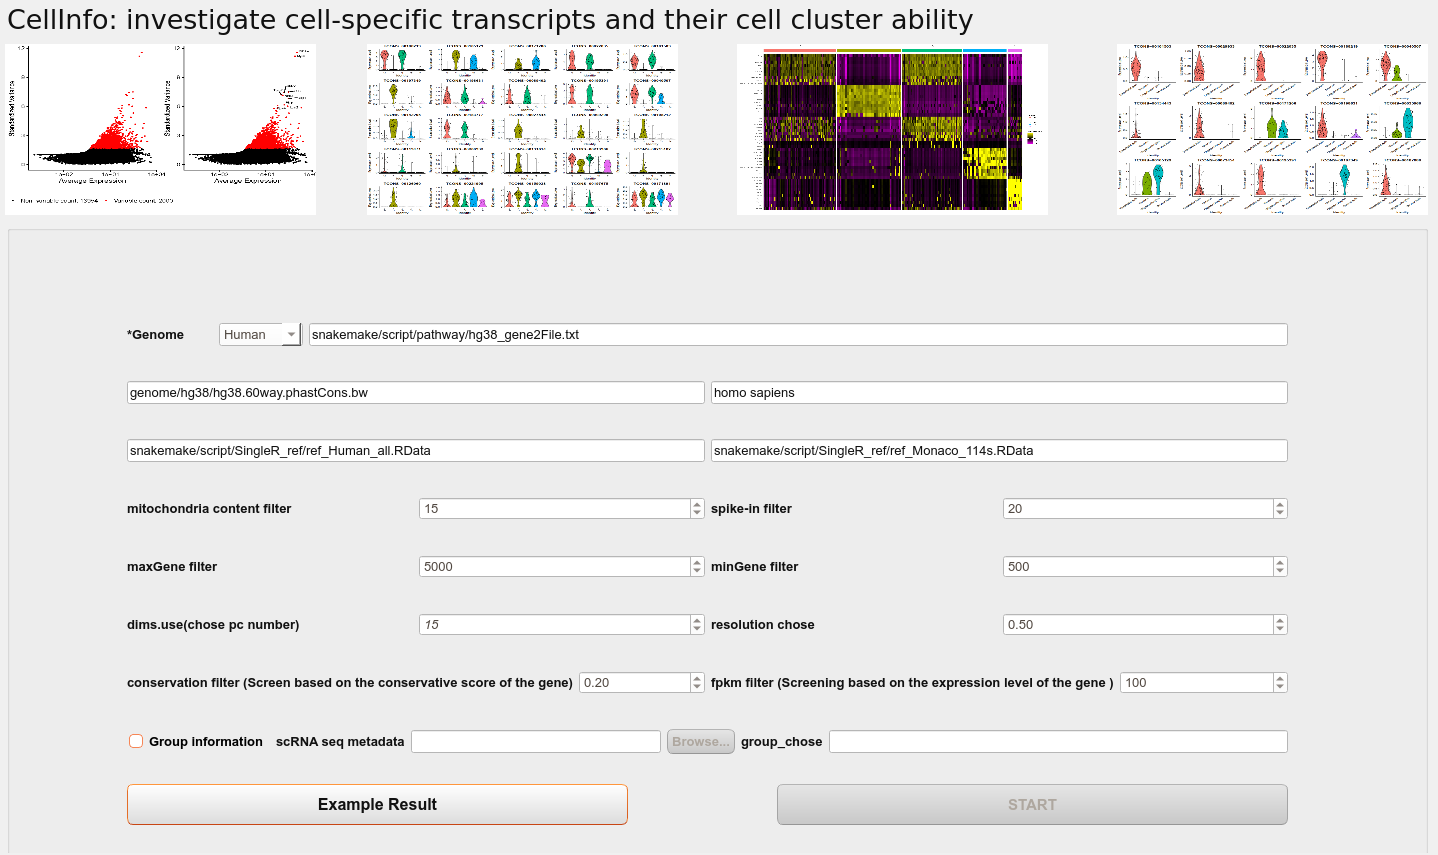
Genome
Select the species of the data(Human or Mouse).
Mitochondria content filter
Remove samples with mitochondrial content above the threshold in single-cell data.
spike-in filter
Remove samples with spike-in content above the threshold in single-cell data.
maxGene filter
Remove samples with the number of genes above the threshold.
minGene filter
Remove samples with the number of genes below the threshold.
chose pc number
Dimensions of reduction to use as input.
resolution chose
Value of the resolution parameter, use a value above (below) 1.0 if you want to obtain a larger (smaller) number of communities.
Conservation filter
Remove the transcripts whose conservation is lower than the threshold in the unannotated cluster marker gene.
fpkm filter
Remove the transcripts whose expression is lower than the threshold in the unannotated cluster marker gene.
Group information
If the user provides group information, you can check the Group information option, and use the Browse button to select the file, and enter the group you want to display in the group_chose column.
Note
The file needs to have a column named “sample”.
Then the user can run the program by clicking START button.
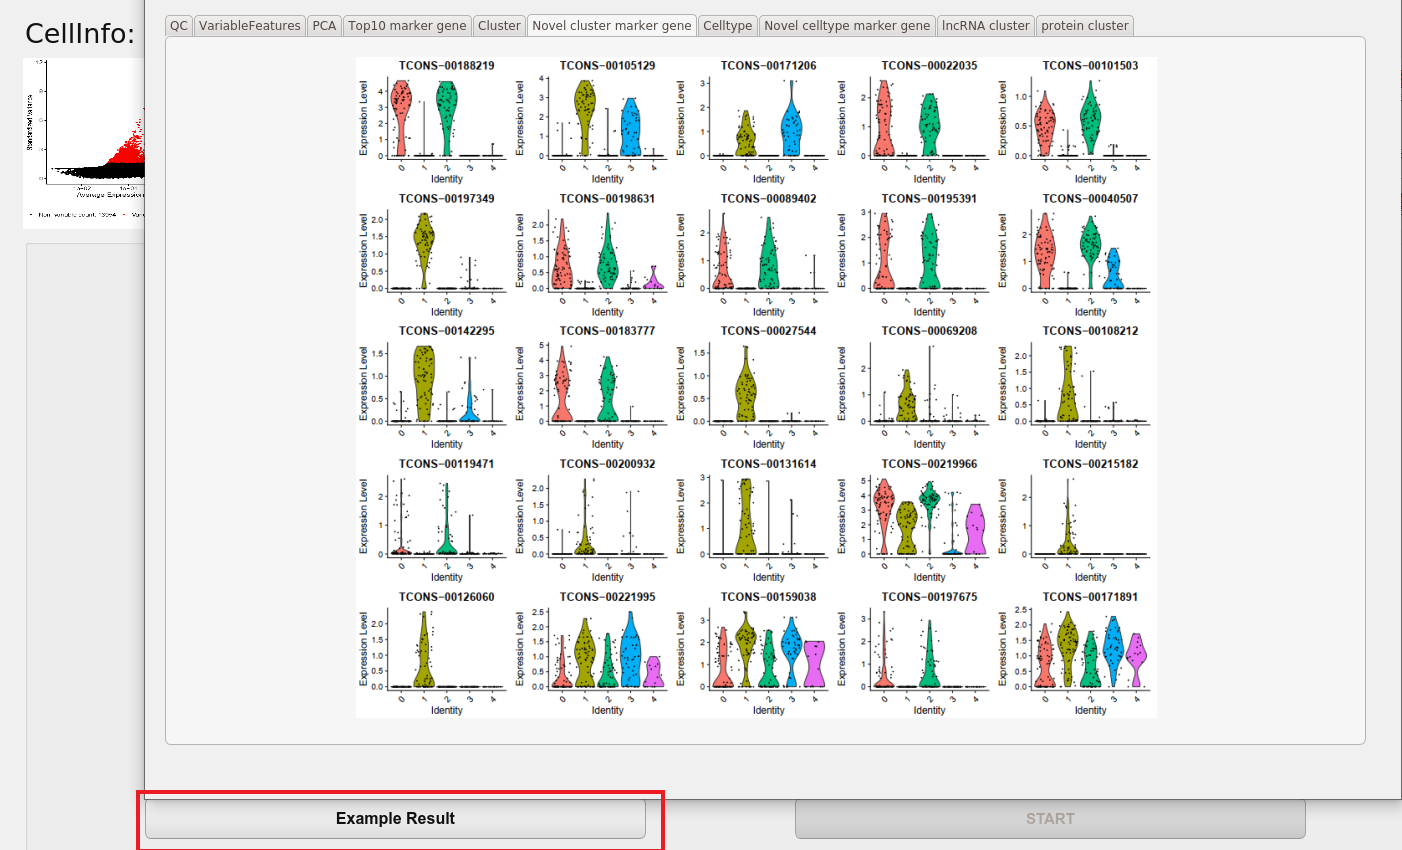
After the program runs, the user can view the results by clicking the Example Result button.
Example Result